About an hour of setup per project (est.), now done by one form.
A form submission now creates the project, documents and team handoff. Delivery starts with a consistent workspace instead of an hour of copying.
~1 hrsetup removed per project (est.)
95nodes in the live workflow
Read more
The business problem
A project manager read each new request, identified the service and hand-built the ClickUp structure: lists, tasks, custom fields, owners, brief documents and the Slack handoff. It took about an hour, and different people built projects differently. Downstream reporting needed manual reconciliation because the structures did not match.
What changed
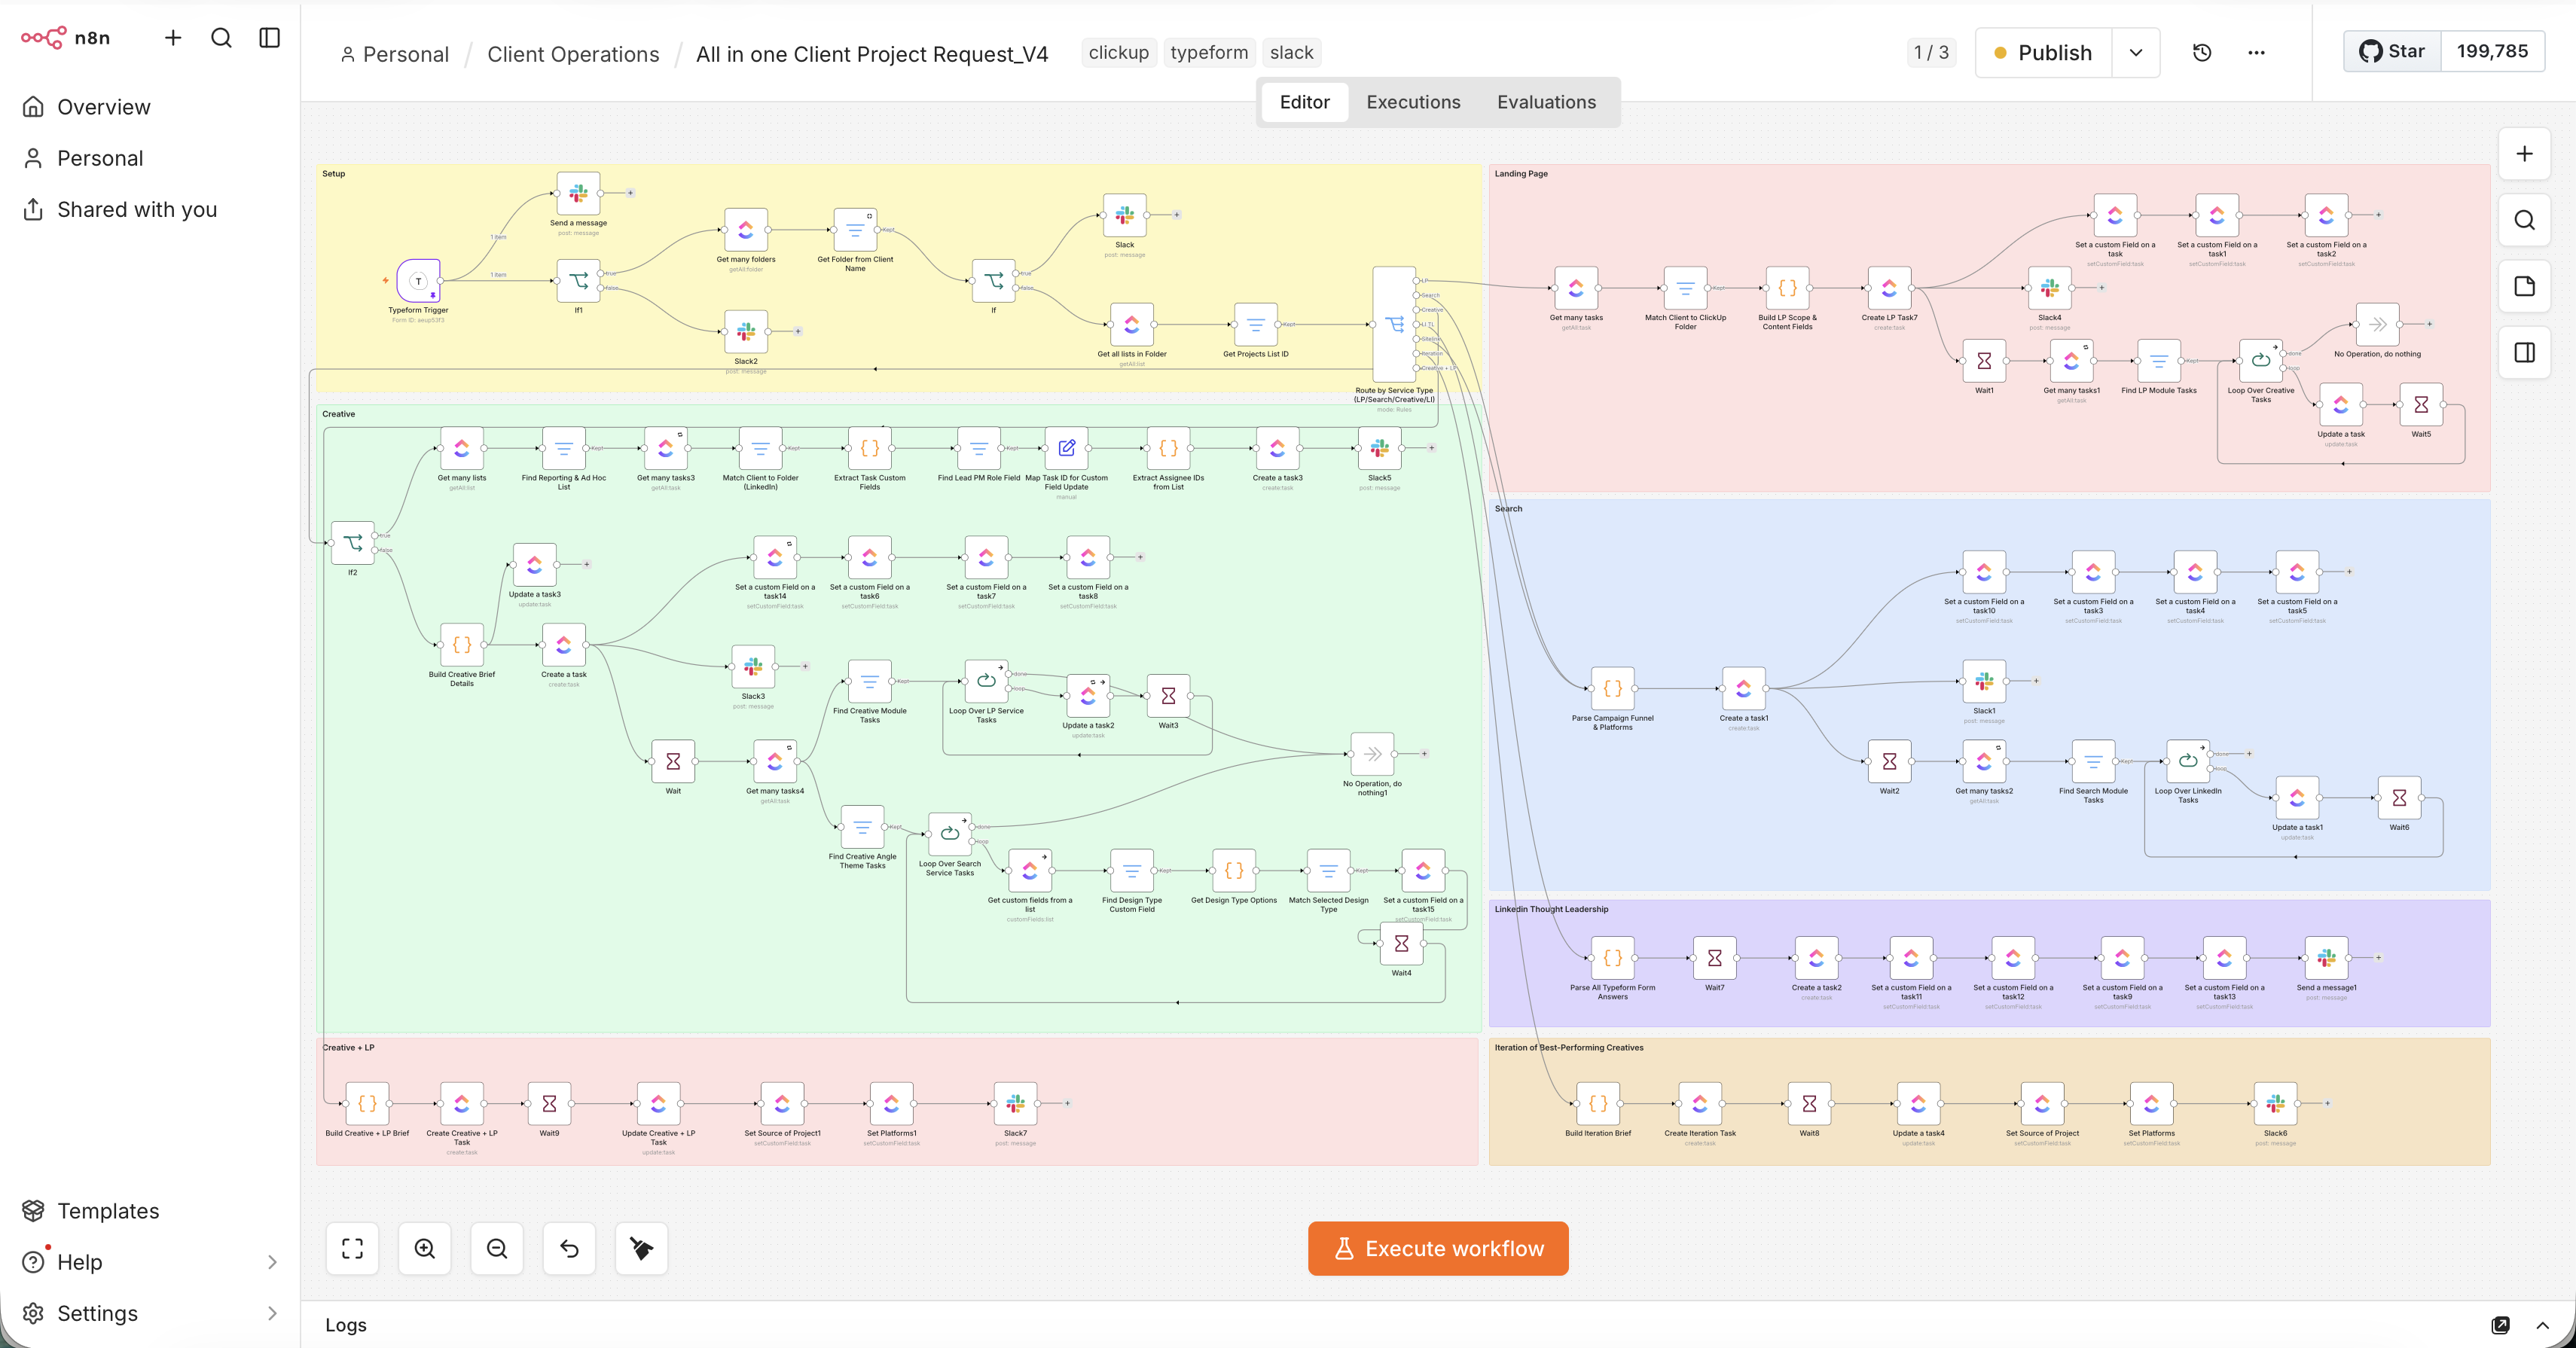
Yash built a single form-triggered n8n workflow with seven service branches. Each branch owns the correct fields, briefs, assignees and handoffs. Shared setup and API handling stay together instead of drifting across seven separate automations.
Before & after
Area
Before
After
Project setup
About one hour of manual copying
One form builds the project scaffold
Consistency
Different field names and task shapes
A repeatable structure for each service
Failed submissions
Risk of a workspace that only half-builds
Explicit error routes with the submission attached
The business value
About one hour of manual setup is removed per new project. The live workflow has 95 nodes, seven labelled service branches and 16 branch points. It evolved through four iterations, with exported JSON kept in version control.
How to read the return
About 20 new projects a week came through the form, so roughly 20 hours of project-manager time came back every week: about half a full-time role. Both figures are the team’s estimates; try your own numbers in the calculator below.
Why the system is dependable
ClickUp field labels can change, so the workflow addresses fields by stable UUID. API calls are batched against rate limits with explicit timeouts. Eleven nodes have explicit error handling, and failed submissions reach a dedicated Slack channel with their payload intact.
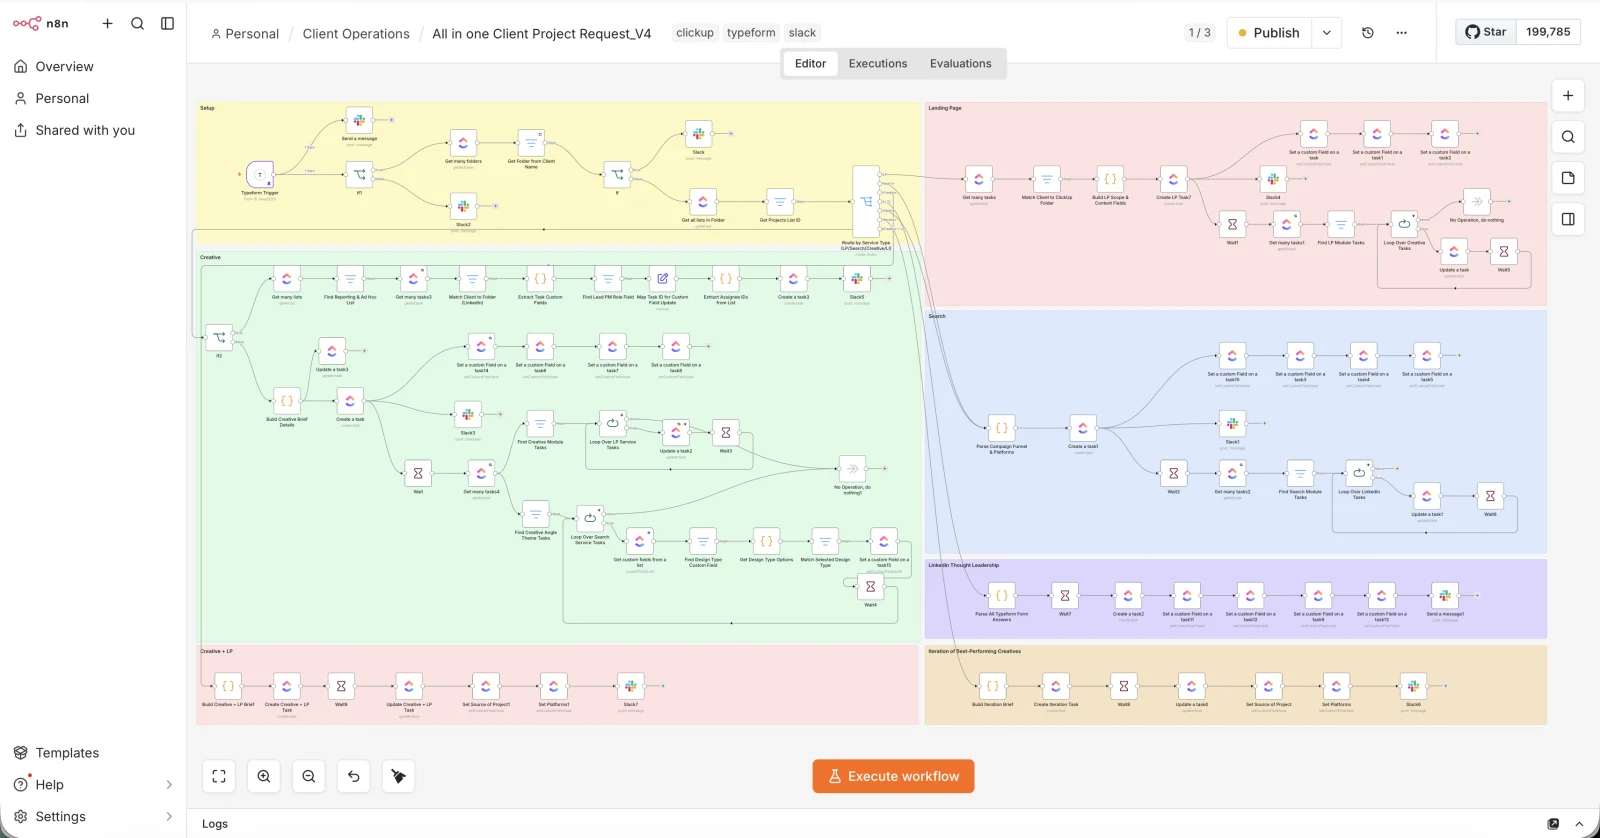
Actual project-request workflow in n8n. Open the full canvas below to explore the implementation.
Could this work for your team?
If every new client or project starts with rebuilding the same workspace, this is a practical place to win time back and make delivery more consistent.
48 live workflows. Routine work on its own triggers.
Client requests, time-off cover, data syncs, digests and follow-ups run automatically, with error handlers and a watchdog that flag failed or missing runs.
48active n8n workflows
1,875nodes across the n8n estate
Read more
The business problem
A project request arrives. A contract is signed. Someone goes on leave. A client needs attention. Each event starts a chain of small jobs across forms, project tools and Slack. When those handoffs depend on people remembering every step, work stalls quietly.
What changed
Yash leads design, implementation and handover across the automation estate. A 95-node project-request workflow handles Typeform intake and ClickUp scaffolding. Other workflows cover ETL, client lifecycle, team allocation, triage and reporting. Zapier handles selected triggers and hands richer logic to n8n; its 59 live Zaps belong to the agency’s shared workspace.
Before & after
Area
Before
After
Client requests
Manual setup across tools
A connected, 95-node intake workflow
Operational data
Separate systems to reconcile
Pipelines into a shared warehouse
Workflow failures
A missing update someone notices
Error handlers and scheduled-run checks
The business value
The n8n estate contains 110 workflows, 48 active, with 1,875 nodes excluding sticky notes. The agency’s shared Zapier workspace has 59 live Zaps. Yash’s role spans design, implementation and handover across the estate.
How to read the return
48 of 110 n8n workflows are active, covering intake, time-off cover, data syncs, digests and reliability checks. Hours per process were not tracked, so no total saving is claimed; use the calculator with your own volumes.
Why the system is dependable
Automation should be observable, not just automatic. The intake workflow evolved through multiple major versions, with a separate development-stage copy for iteration. Error handlers and a “did it actually run?” watchdog are part of the system, not a maintenance afterthought.
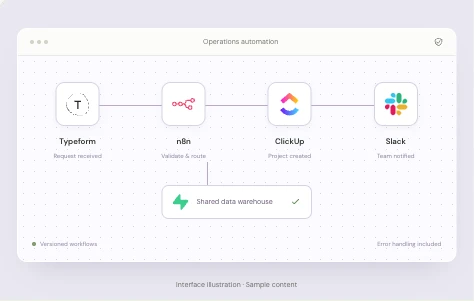
Illustration of the project approach, using sample interface content.
Could this work for your team?
If every new client, request or team change starts a checklist of manual jobs, there is a workflow here worth simplifying.
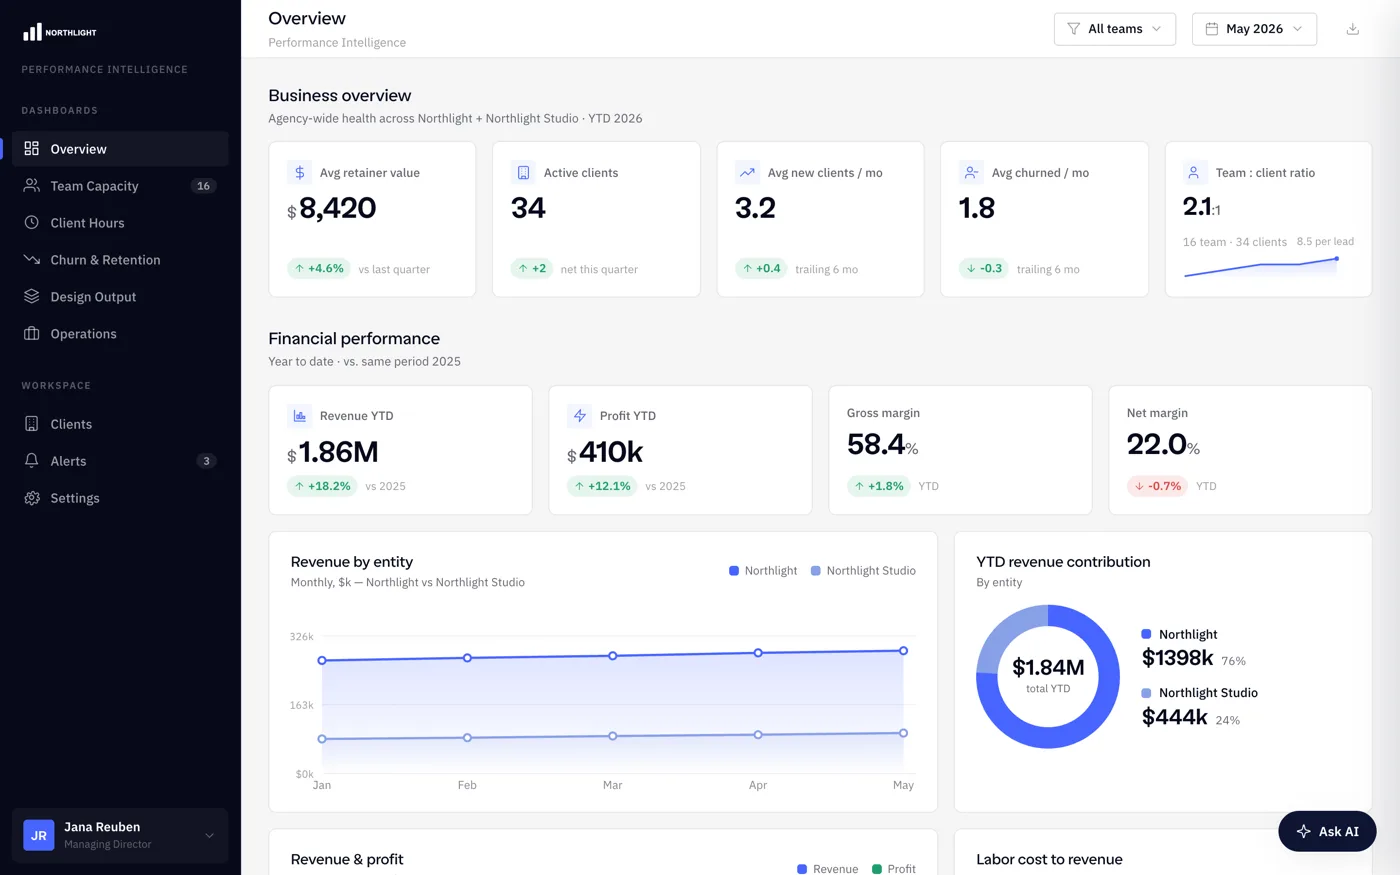
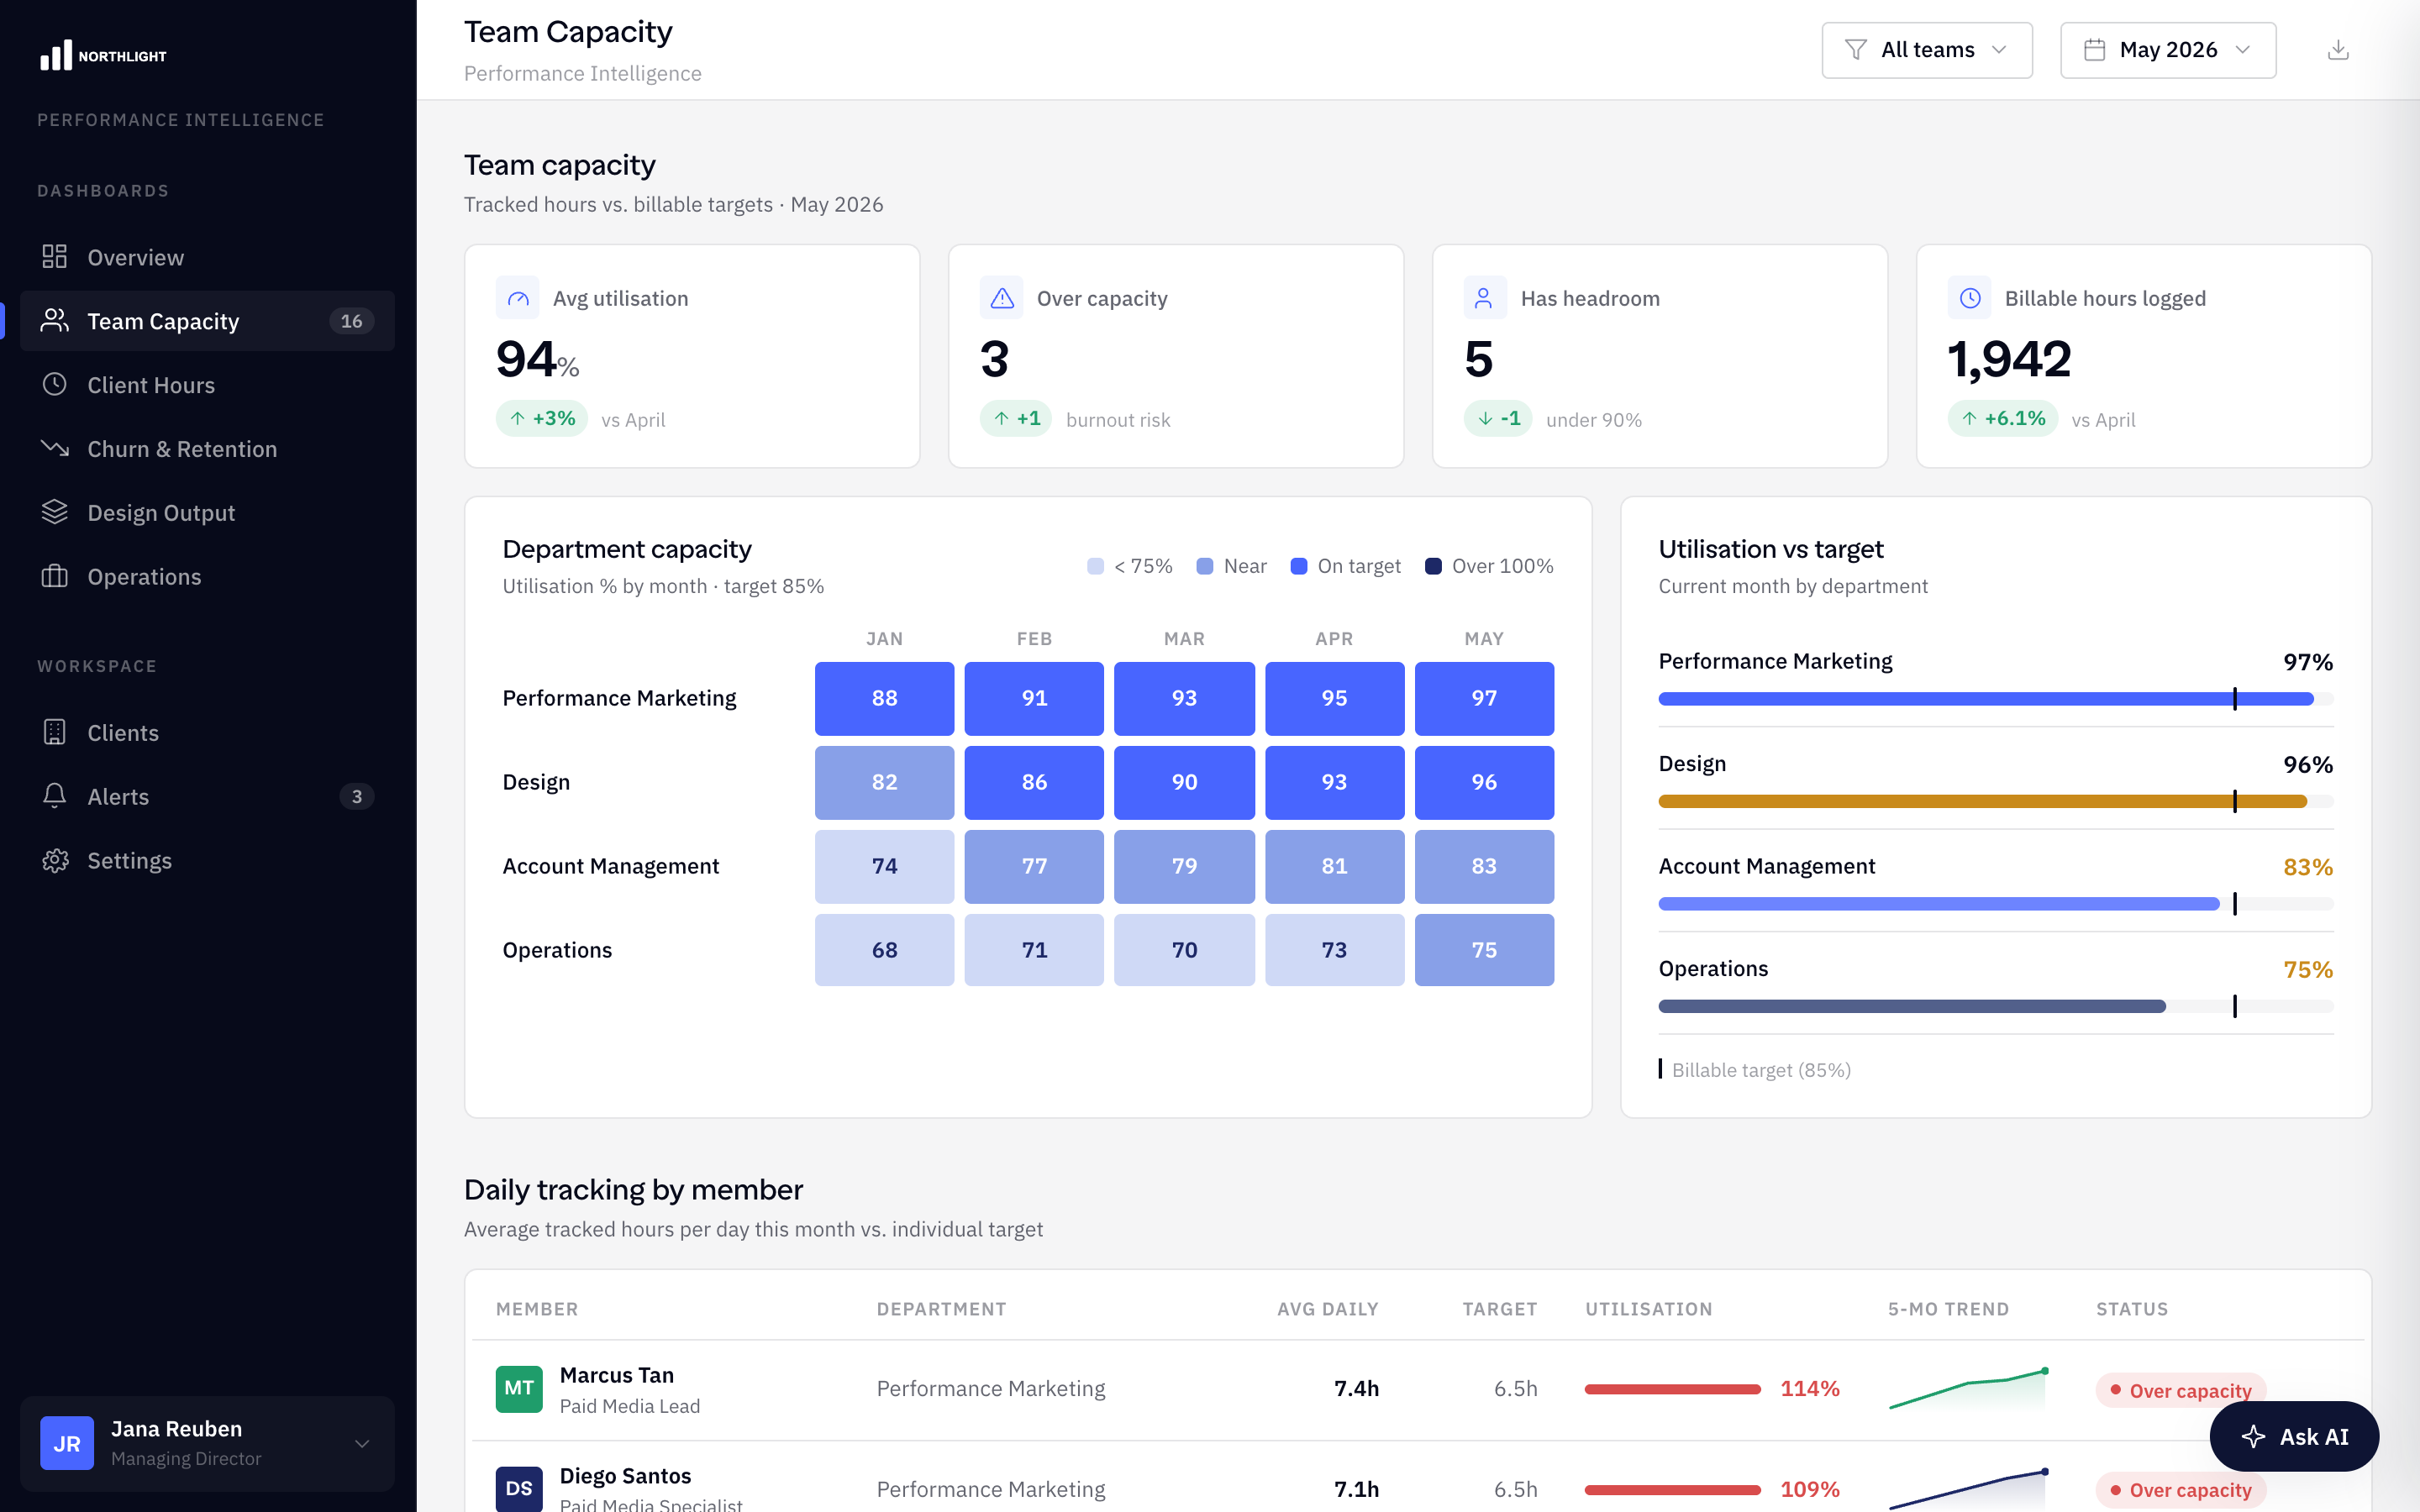
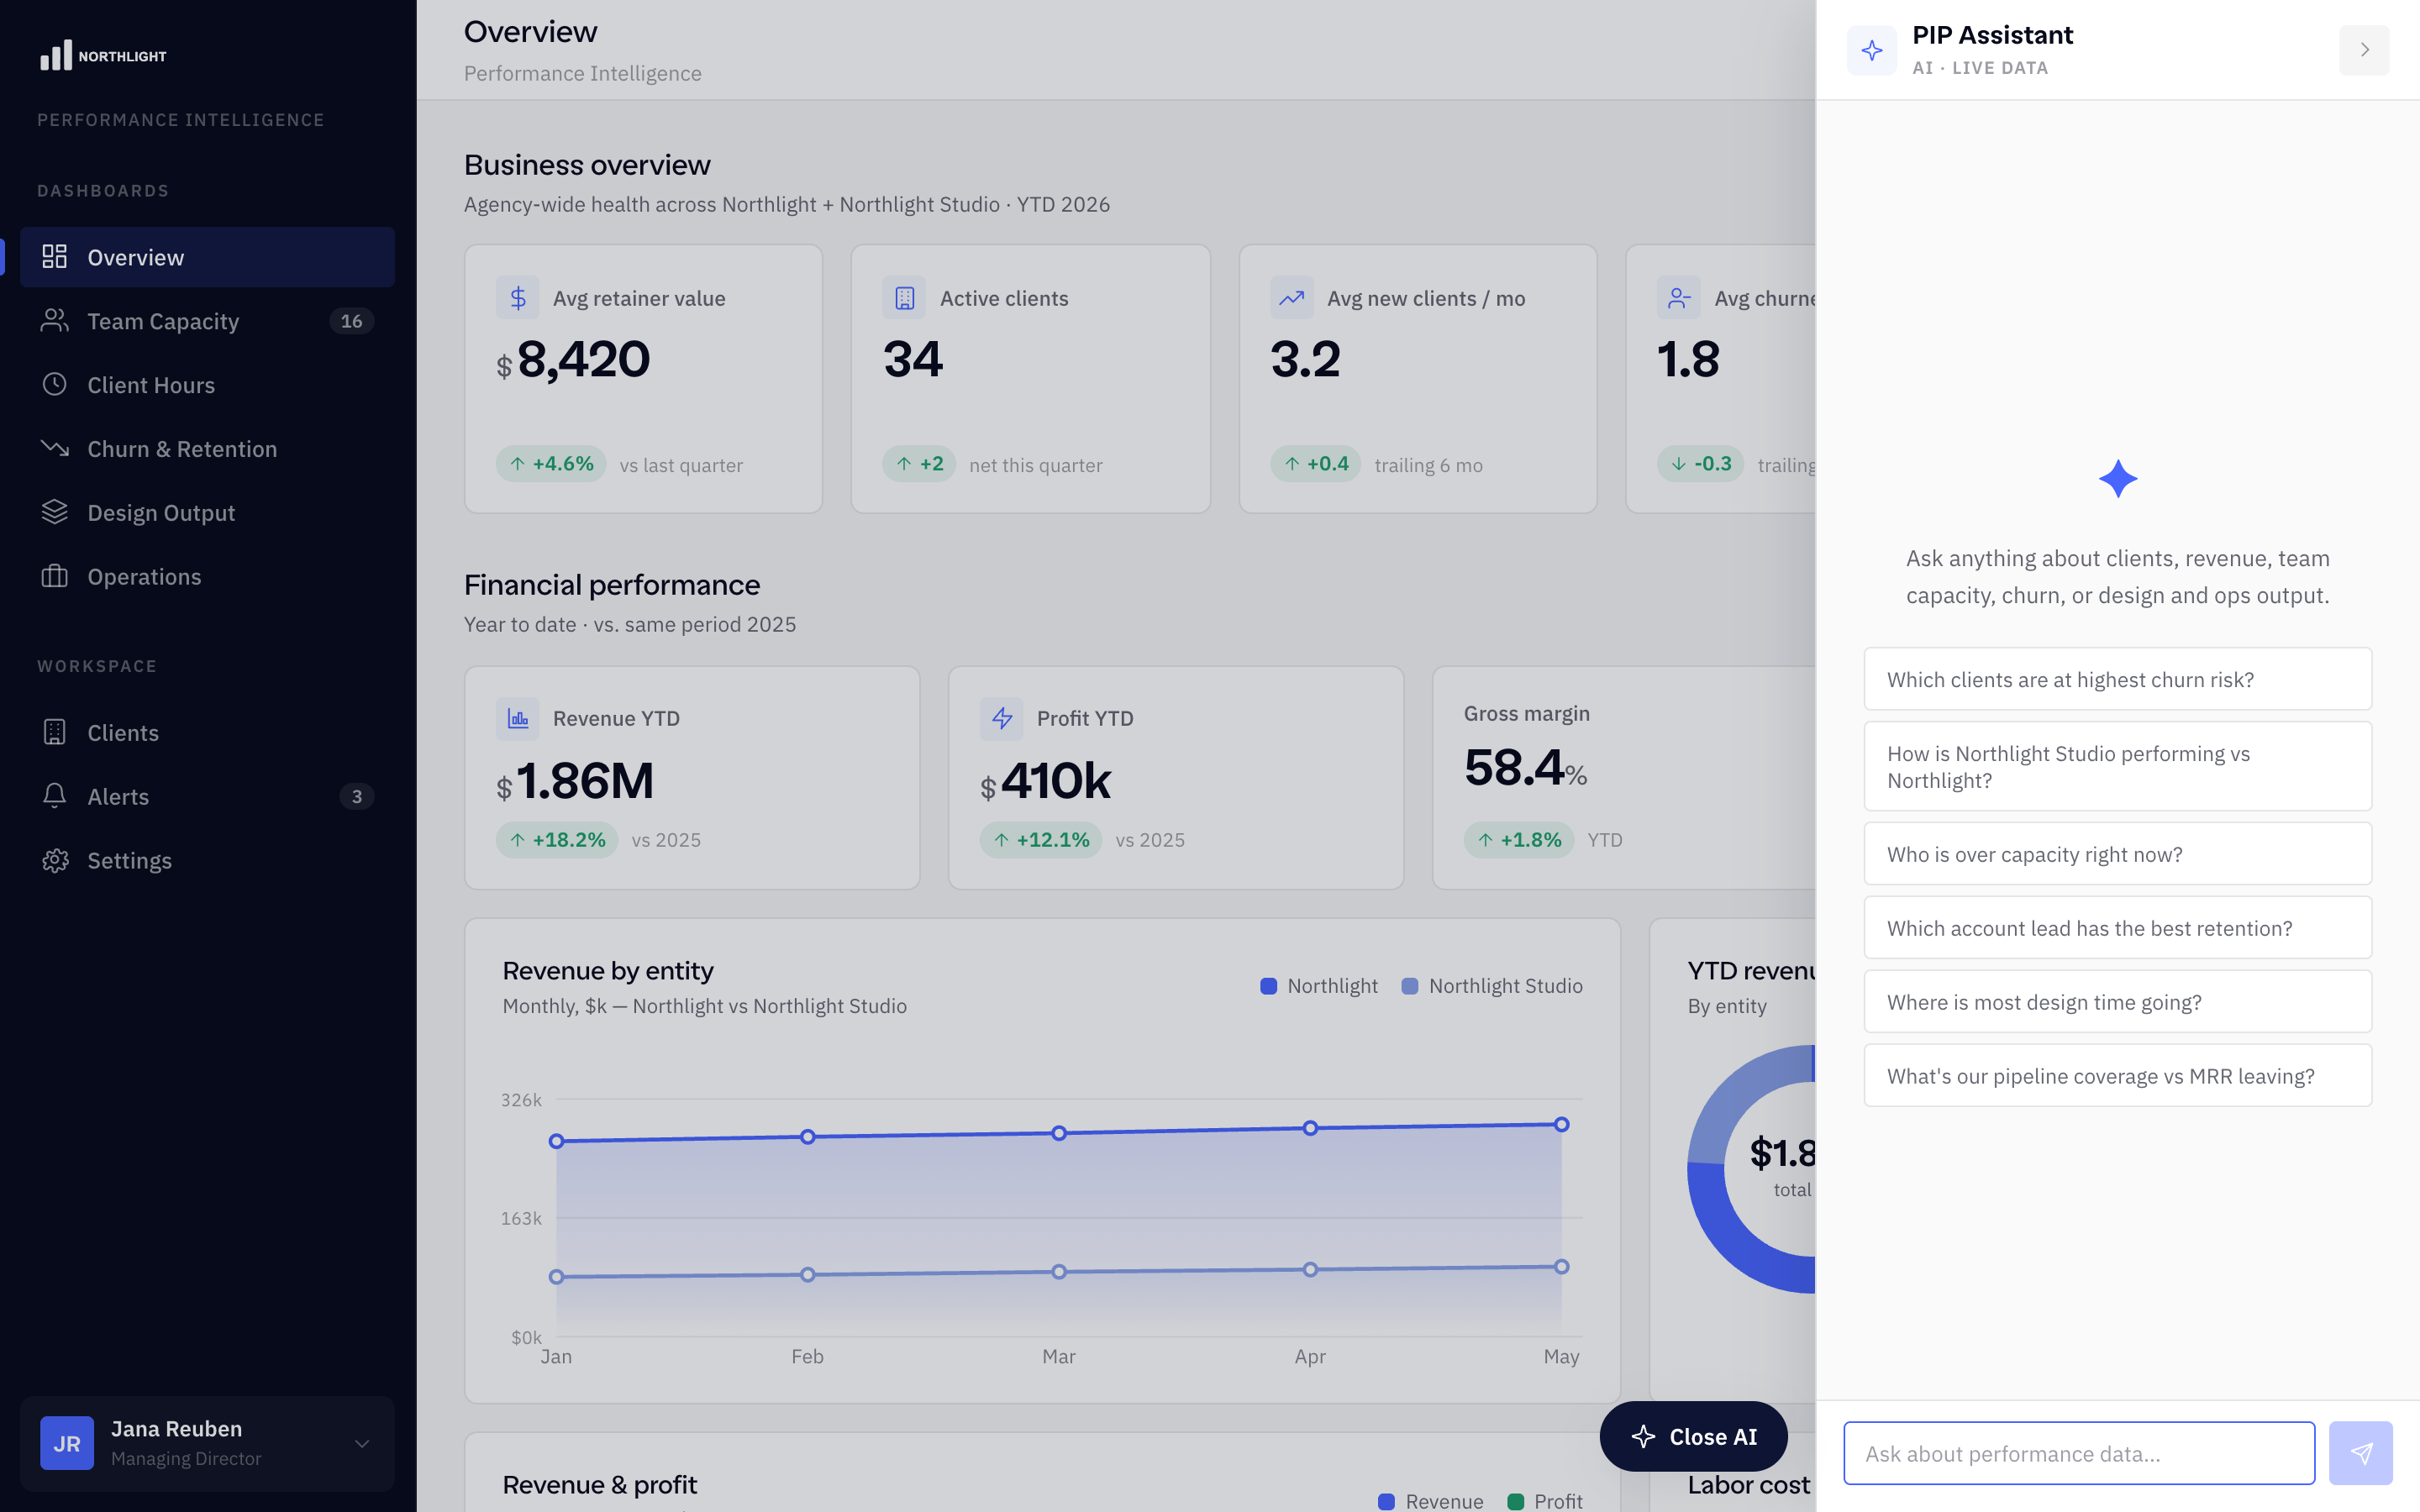
Five systems. One set of numbers to run the week on.
Leadership reviews capacity, delivery, churn and margin in one place, instead of debating which department spreadsheet is right.
5 → 1systems combined into one view
291,550reconciled time-entry rows
Read more
The business problem
Leadership had no single source of truth for clients, capacity, delivery, churn or margin. Metrics lived in department spreadsheets and differed depending on who prepared them. In one instance, inserting a column corrupted 352 cells without anyone noticing.
What changed
Yash built a shared Postgres warehouse, 18 dashboard screens and two API routes. Time tracking, task data, Slack-sourced sentiment, finance sheets and subscription data flow into the same model. Purpose-built aggregation queries define each metric. An AI analyst reads those metrics through tools, with read-only SQL enforced in the database.
Before & after
Area
Before
After
Reporting
Per-department spreadsheets
18 connected dashboard screens
Metric confidence
Silent formula breakage
Verification against legacy figures
AI answers
Risk of a second set of numbers
The same datasets as the dashboard
The business value
Weekly leadership reviews run on the platform instead of the spreadsheet. The verified time-entry dataset contained 291,550 rows with zero duplicate IDs, and ingestion was checked against the source API before relying on it.
How to read the return
Weekly leadership reviews now run on the platform. Metrics were reconciled against the legacy spreadsheets before the switch, and the 291,550-row time-entry table is verified with zero duplicate IDs. Reporting-time and revenue gains were not measured.
Why the system is dependable
The useful part of a dashboard is the definition behind the number. Contract values are normalised by payment frequency, metric parity is checked before switchover, and data-quality caveats are shown in the interface. The AI’s database access is enforced as read-only in Postgres.
AI agents & quality assuranceCompleted pilot · Retired
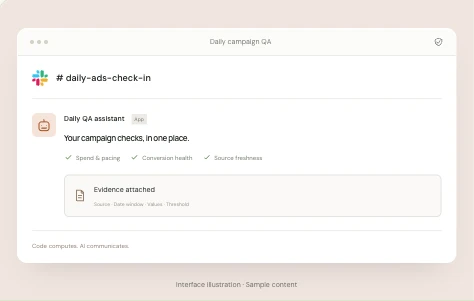
The daily account checklist, piloted as an on-demand agent across four ad platforms.
A paid-media checklist became an on-demand agent review across Google, Meta, LinkedIn and Bing, with the source data and thresholds attached to every finding.
9deterministic checks
4ad platforms in the pilot
Read more
The business problem
Daily account checks were manual, varied between analysts and left no durable history. Trends disappeared into conversations. Simply asking an LLM to read a dashboard would introduce another problem: a spend figure that changes or gets invented is unacceptable in client-facing work.
What changed
The system reverses that pattern. A deterministic query planner owns source IDs, metrics and date windows. Code calculates the results and applies a nine-check catalog covering pacing, spend anomalies, conversion health and freshness. Claude provides the MCP transport and can polish the narrative, but does not originate the numbers.
Before & after
Area
Before
After
Daily checks
Different analyst routines
One explicit nine-check catalog
Findings
No consistent supporting record
Source, window, values and threshold attached
Stale data
Risk of misleading conclusions
Freshness gates with explicit fallback behavior
The business value
Nine checks ran against three pilot accounts across Google, Meta, LinkedIn and Bing. Each result carries the evidence to replay it. The on-demand pilot is retired; it was not a standing, unattended system across the full client book.
How to read the return
A completed and retired pilot on three accounts. It shows the pattern; no sustained saving or ad-performance lift is claimed.
Why the system is dependable
The model never originates a metric. A stale data source is excluded from claims, and a missing monthly budget produces an explicit limitation instead of a fabricated pacing answer. Each finding includes a replayable evidence object.
Illustration of the project approach, using sample interface content.
Could this work for your team?
If your team repeats the same account checks every morning, this approach turns the checklist into a consistent, reviewable system.
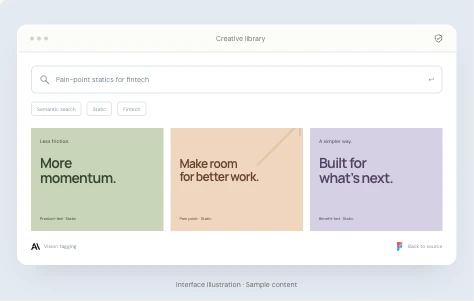
Designers search past work by idea, angle or format and jump straight to its Figma source, instead of an afternoon of digging through shared drives.
129client folders searchable
768embedding dimensions
Read more
The business problem
Past creative lived across 129 client folders behind an inconsistently followed filename convention. Designers could browse files, but they could not search by idea, messaging angle or visual concept. Useful work was difficult to find and reference.
What changed
Yash built a resumable migration pipeline, a four-stage AI tagging system and a Pinterest-style gallery. The search combines semantic retrieval with structured filters, while deep links take designers back to the source Figma frame. Client consent flags govern which work can appear in a public showcase.
Before & after
Area
Before
After
Finding references
Browse folders and guess filenames
Search concepts and apply filters
Asset context
Inconsistent naming
Four independently resumable tagging stages
Reusing work
Find the file, then locate its source
Direct links from creative to Figma
The business value
The production library brings 129 migrated client folders into a searchable archive. Four independently resumable tagging stages make the catalog maintainable as the collection grows.
How to read the return
129 client folders became one searchable, reusable archive. Search time and reuse rates were not measured.
Why the system is dependable
Useful AI systems leave room for uncertainty and human judgement. The filename parser extracts what it can and flags uncertainty. Human-edited metadata is treated as locked, and unchanged embeddings are skipped through content hashing.
Illustration of the project approach, using sample interface content.
Could this work for your team?
If your best previous work is buried in folders, semantic search can turn that archive into an everyday working tool.
Creative analytics & AIProduction bank · Prototype analytics
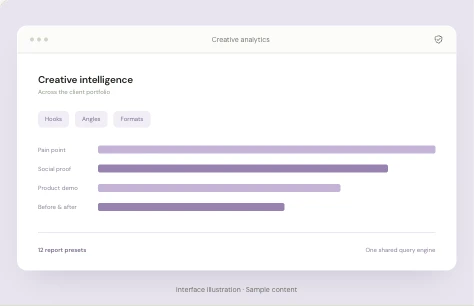
Creative insight designed for 40+ clients, not one account at a time.
Built so the team can compare hooks, angles and formats across the portfolio: the inspiration bank is live; the cross-client analytics engine is an advanced prototype.
40+clients in analytics scope
12report presets
Read more
The business problem
Creative insight was trapped inside individual client ad accounts. The team needed to compare hooks, angles and formats across its portfolio, while spend-based enterprise software pricing made the build-versus-buy decision worth examining.
What changed
In this co-owned build, Yash contributed a shared reports engine, a Python source resolver and the inspiration bank. A structured creative taxonomy lets one query engine drive twelve report presets. Some report views still use a fixed dataset; connecting the full client book is a later phase.
Before & after
Area
Before
After
Creative insight
Siloed by client and platform
A cross-client analytics design
Reporting architecture
Separate report implementations
Twelve presets on one shared engine
Inspiration
Links and screenshots scattered across tools
A searchable production inspiration bank
The business value
The inspiration bank is in production, with a reporting engine at advanced-prototype stage. The analytics scope covers 40+ clients, with twelve report presets and nine resolver strategies.
How to read the return
The inspiration bank is live; the analytics engine is an advanced prototype. Cross-client reporting is a capability, not a proven campaign-ROI uplift.
Why the system is dependable
Build-versus-buy came before the code. The brief documented alternatives, cost projections and explicit non-goals. A seven-day cache and in-flight request deduplication reduce repeated paid API calls; the source resolver uses a separate service for media processing.
Illustration of the project approach, using sample interface content.
Could this work for your team?
If you manage creative across many accounts, a shared taxonomy makes the portfolio easier to learn from.
87 client workspaces a month, reset without manual work.
Each month, about 87 client workspaces went through the same eight-step manual sequence. An unattended job now prepares, archives, tracks and announces them: about 1,000 workspaces a year at that rate.
87client workspaces a month
~10 hrsoperations time back weekly (est.)
Read more
The business problem
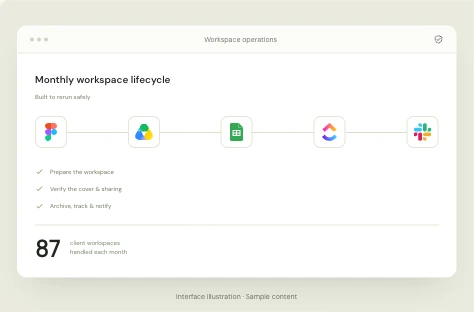
Every month, someone repeated the same sequence for about 87 clients: duplicate the Figma template, rename it, set sharing, update the cover, archive the previous month, update a sheet, close a task and notify the account manager. The work was necessary, but the manual repetition was not.
What changed
An unattended TypeScript job now coordinates the lifecycle across Figma, Drive, Sheets, ClickUp and Slack. It uses vendor APIs where available, and verified UI automation for operations with no API. The wider suite structures client-health signals from Slack into ClickUp and supports verified prospect research.
Before & after
Area
Before
After
Monthly setup
Repeated manual work across 87 clients
An unattended cross-tool lifecycle
Partial failures
Risk of duplicated work on rerun
Exact-title checks and repair-only mode
Client risks
Signals lost in Slack conversations
Assigned records with linked threads
The business value
About 87 client workspaces are handled monthly without manual coordination. A separate research pipeline in the same suite delivered 542 verified records in about three hours and roughly $1 in API spend, with an audit trail for disqualifications.
How to read the return
At roughly 30 minutes of manual work per workspace (estimated), that is about 43 hours a month, or ~10 hours a week. A research pipeline in the same suite also delivered 542 verified prospect records in about three hours for roughly $1 in API spend, instead of days of manual sourcing.
Why the system is dependable
Reliability is in the rerun. The job checks the live workspace before creating anything, re-reads changes after writes and provides a repair-only command. Twelve unit tests cover the workspace automation.
Illustration of the project approach, using sample interface content.
Could this work for your team?
If an important monthly process still lives in someone’s recurring checklist, it may be a good candidate for a dependable cross-tool automation.
Use your own numbers to estimate the capacity a repetitive workflow could give back. Start with the project-intake example: about one hour saved per setup (estimated).
This estimates capacity value, not guaranteed cash savings. The return depends on actual usage, adoption and what your team does with the recovered time.
40 hrscapacity recovered per month
$2,400monthly capacity value after running costs
$28,800annualised capacity value
Add build costsimple payback estimate
Illustrative inputs, not a quote or a measured client result. Runs only in your browser; nothing is sent. Simple payback uses build cost ÷ monthly value after running costs; taxes, ramp-up and opportunity costs are excluded.
What would you do with that time back?
Bring an app idea, a workflow or a team learning goal. We’ll map a useful first step together.
 n8n
 Typeform
 ClickUp